
How Data Helps Physical Stores Make Better Decisions
Physical stores generate information every day, but sales figures alone do not explain what happens before a purchase. Retailers also need to understand store traffic, customer dwell time, busy areas, and differences between locations. This is where data analysis becomes useful. It connects store activity with measurable data and gives teams a clearer basis for daily decisions.
For retailers, restaurants, and large chains, the value comes from making store information easier to read and compare. Instead of relying only on manual observation, managers can review data over time and identify changes that may need attention.

What Data Can Physical Stores Measure?
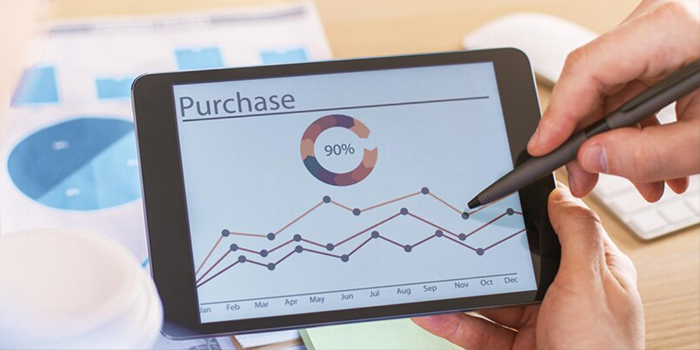
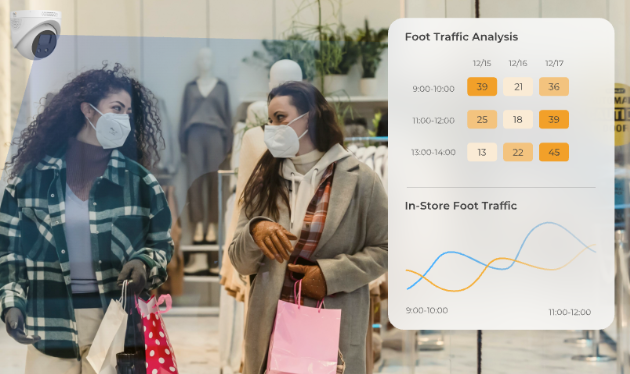
A physical store can collect several types of operational data. Foot traffic shows how many people enter or leave a location. Dwell time indicates how long visitors stay in a space. Heatmaps can show which areas receive more activity. Together, these figures provide a more complete view of store behavior. With retail analytics, businesses can organize these data points and better understand customer movement patterns inside physical locations.
Customer flow can also be compared with sales, staffing, promotions, or store layouts. For example, a location may receive steady traffic but have short dwell times. Another store may have fewer visitors but longer stays. These differences can guide further investigation instead of relying on assumptions.
For chain retailers, the same data can be reviewed across multiple locations. Managers can compare time periods, identify changes, and check whether a store follows the expected operating pattern. This helps regional and headquarters teams compare stores.
Why Real-Time Data Matters
Store conditions can change during the same business day. A lunch period may create a traffic peak in a restaurant, while a promotion can increase visits to a retail store. Real-time information gives managers a way to notice these changes as they occur.
A people counter can track walk-in and walk-out activity and provide dwell-time data. Our Binocular people counter uses a built-in video analysis intelligent algorithm for real-time tracking of walk-in, walk-out, and dwell-time counts. This type of data can help teams understand traffic patterns without depending only on manual counting.
Real-time data also supports faster operational checks. If traffic changes sharply at a certain time, managers can compare that change with staffing, promotions, or other store conditions.
Using AI for Customer Understanding
Counting visitors is only one part of store analysis. Some businesses also need to understand the general characteristics of their customer base. AI-based analysis can add another layer of information to regular traffic data.
Our people counting solution uses embedded AI algorithms to identify gender and age groups. This can help businesses study customer composition and compare patterns between stores or periods. Such information may support decisions about product placement, campaign planning, and store operations.
The key is to treat these figures as business reference data rather than isolated results. A change in customer composition may have different meanings depending on location, season, opening hours, and store format. Reviewing several data points together can make the analysis more practical.
From Store Data to Daily Operations
Useful analytics should connect with real store management. Traffic data can support staffing discussions, while dwell-time data may help teams examine whether customers spend enough time in key areas. Heatmap information can also help retailers review how customers move through a store.
For large chains, consistency matters. Store managers and headquarters teams often need the same indicators so that locations can be compared in a clear way. This is one reason retail analytics solutions can support more than visitor counting. They can become part of a wider process for reviewing store performance.
Existing CCTV systems can also become part of store data analysis. AI-NVR technology allows businesses to connect suitable camera resources with intelligent analysis functions, helping retailers explore traffic patterns without replacing their entire infrastructure.
Connecting Analytics With Broader Store Management
Store analytics can also work alongside other digital management functions. At OVOPARK, our solutions cover areas such as AI store inspection, customer flow analysis, shelf operations, loss prevention, employee behavior detection, and Smart OA. These functions address different parts of daily store management.
Companies developing retail analytics solutions usually combine technologies such as computer vision, machine learning, and artificial intelligence. These technologies help transform store activity into structured information that managers can review.
For retailers and restaurant chains, this broader approach can help connect separate operational tasks. Customer traffic may show what is happening in a store, while inspection and shelf data can help explain some of the conditions behind that activity. The goal is to make store information easier to use in routine management.
Making Store Decisions More Data-Based
Retail analytics is useful because physical stores contain more operational information than sales numbers alone can show. Traffic, dwell time, customer characteristics, and movement patterns can help managers understand what is happening inside a location.
The practical value of retail analytics solutions comes from connecting data with real tasks. For retailers, restaurants, and large chains, OVOPARK focuses on combining AI, video analysis, and store management functions into usable workflows. When store data is clear and connected to daily operations, teams can make decisions with a more informed view of what is happening on site.