Why a Busy Shopping Street Can Still Produce a Quiet Store
Picture a crowded high street. The pavement is full, the street feels lively, and yet the store behind the glass has few people browsing. It prompts a question retailers raise often: “The street is busy, so why is the till so quiet?”
At OVOPARK, we start from the view that a busy street and a busy store measure two different things. Street traffic tells you how many people had a chance to notice a shop.
Store traffic tells you how many chose to come in. Sales sit one step further along. When those three numbers blur into one impression, it is hard to say where the problem sits.
Passersby are potential customers, not visitors
Many retailers judge a location by how crowded it looks. A full pavement feels like opportunity, but someone walking to a station or a lunch meeting has not made a decision about your shop yet.
The first gap we look at is the share of passersby who become walk-ins. If a thousand people pass and fifty step inside, the street may not be the issue. The doorway might be.
The window display, the signage, the opening offer and the way the entrance reads from a distance shape that first decision, and without a count on the pavement and a count at the door, any change is a guess.
This is where a footfall counter becomes useful. We developed a range of people counters with different functional positioning, and our passersby counter measures the number of potential customers passing your store.
That information helps identify sales opportunities and tailor marketing efforts. For installation outside, we also offer a passersby model with a waterproof design.
Counting people at the door without inflating the numbers
Once you know how many people pass, the next question is how many enter. Small details change the picture here. If four members of one family walk in together and the system records four visitors, the conversion rate looks weaker than it is.
Our PC8, an AI-powered people counter, is built around this problem. It provides real-time walk-in and walk-out counts, counts a group as one entry, and supports removal of duplicated counts.
It also uses an AI algorithm to detect gender and age, which gives a view of who is coming through the door. The entry figure then sits closer to the number of buying occasions than to a raw headcount.
That changes the conversation with a store team. Instead of “we need more people outside,” the discussion becomes “street traffic is steady, entry dips in the afternoon, so what is different about that period?”
Reading the full journey with footfall analytics
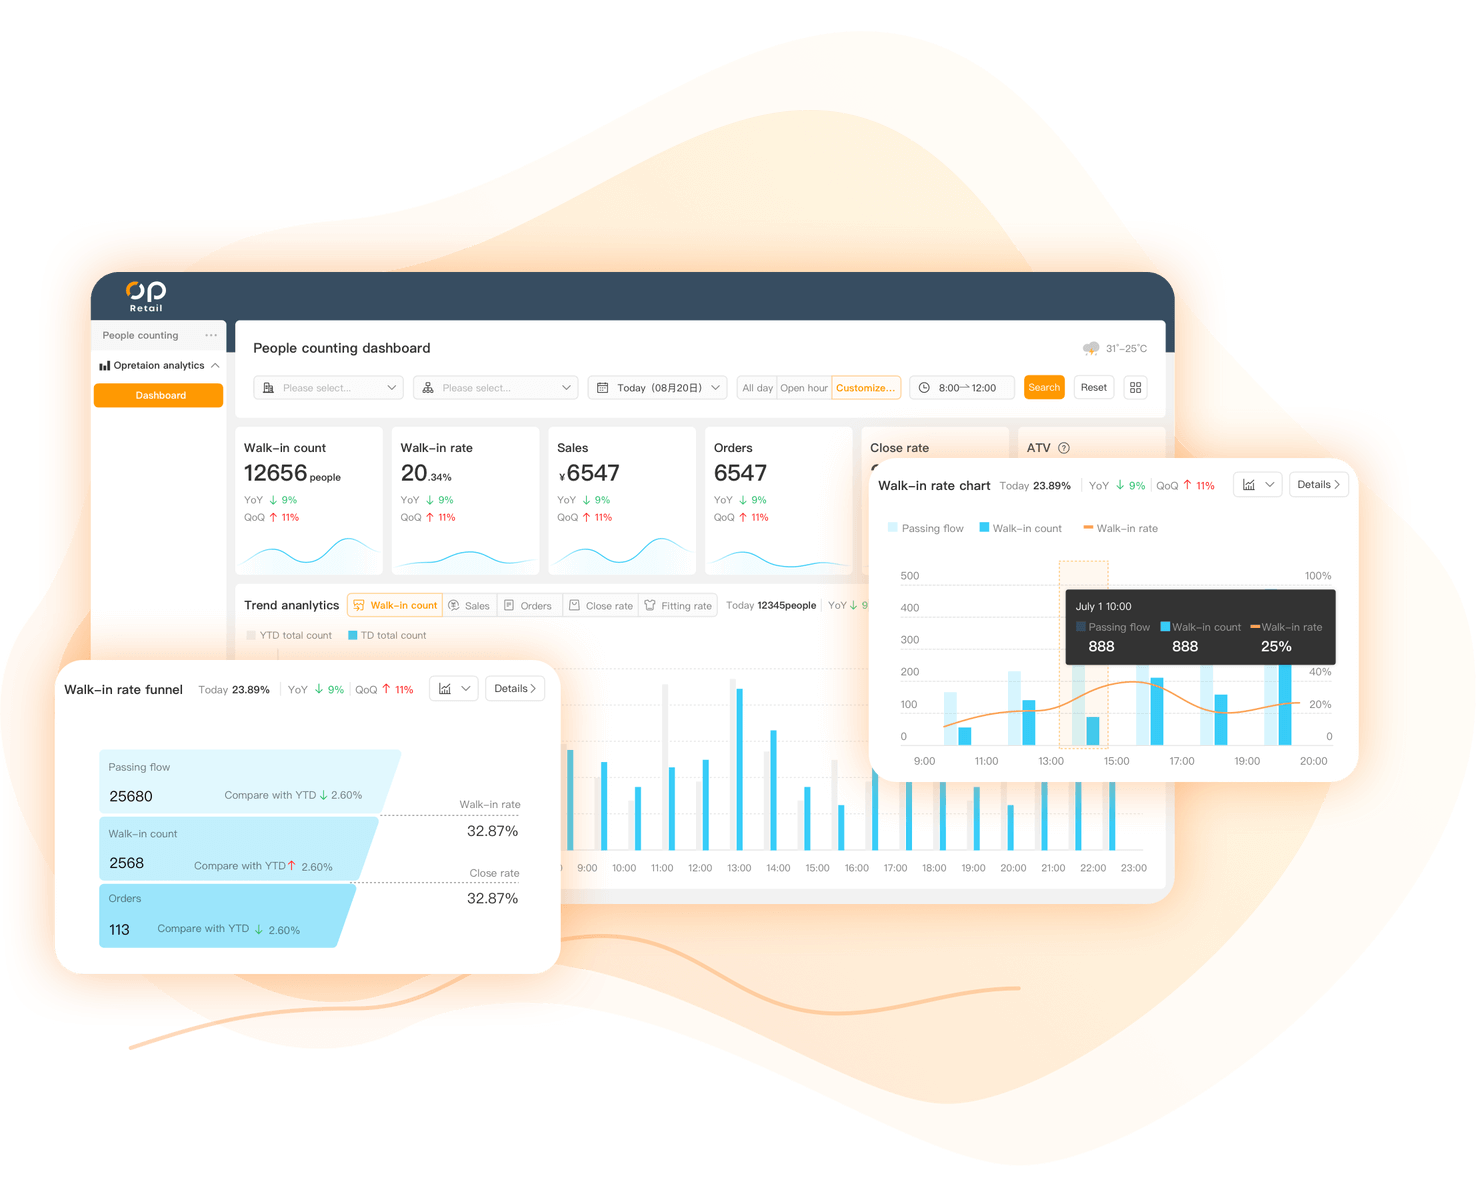
A single number at the door rarely explains a quiet store. The more helpful view puts passersby, walk-ins and purchases side by side. Our footfall analytics solution does this through a funnel analysis that combines customer flow data with the cash register system. You can view walk-in, walk-out and passing-by counts for different entrances and periods, and check store status through an app or on the web.
Seen this way, a quiet store usually follows one of three patterns.
- Few people notice the store.Passerby counts are low even though the street feels busy, which points to visibility, the position of the entrance or the type of crowd on that stretch.
- Many notice, few enter. The passersby figure is healthy but the walk-in share is small. The window, the offer and the entrance are the first places to look.
- Many enter, few buy.Walk-ins look fine and the till is still quiet. That moves the focus inside the store, to layout, stock, queues and staffing at peak hours.
Each pattern calls for a different response. A new window scheme will not help a store whose real issue is a slow checkout.
Comparing stores and testing changes
For chains, one location rarely tells the whole story. Our analytics software also supports multi-store comparison reports. We can select specific time ranges and data conditions to compare store performance, then export the results to Excel for further analysis.
This helps retail managers identify differences between locations and evaluate whether operational changes are producing measurable results. That makes it easier to compare a store on a busy street with one in a quieter neighbourhood.
The solution also covers heatmap analysis, occupancy management, demographic analysis and marketing effectiveness measurement. We suggest using them in sequence. Set a baseline across a normal fortnight.
Then change one thing, such as the window display or the staff rota at the busiest hour, and compare the same funnel afterwards. Changing several things at once makes the result hard to read.
Where to start
If your street is busy and your store is quiet, start small:
- Measure passersby and walk-ins at the main entrance for two weeks.
- Compare the walk-in share by hour and day of the week.
- Link entry data to transactions to see where the drop happens.
- Change one element at a time and read the funnel again.
A crowded pavement is a good starting point, but it is the top of the funnel. With a reliable footfall counter at the entrance and footfall analytics behind it, a quiet store becomes a set of questions you can answer one by one.