
Reading a Month of Store Traffic Without Letting One Rush Decide the Story
Small stores feel a big day more than large ones do. A sunny Saturday, a local event or a short promotion can fill the aisles for a few hours, and the monthly chart jumps. The owner sees a rising line and starts planning around it.
A few weeks later the line settles back, and it becomes unclear which version of the month was the real one.
At OVOPARK, we think this is a common reason small-store reports mislead. The numbers are usually correct. The way we read them is where things drift.
A simple example of how one day moves a month
Take a shop that normally receives about 100 visitors per day. Over a 30-day month, its expected footfall would be around 3,000. Now imagine one busy day brings in 400 visitors instead of the usual 100.
The monthly total rises to 3,300, about 10% above the expected level. Yet the other 29 days remain unchanged, so the increase comes entirely from one unusually busy day rather than sustained growth.
The same effect appears in reverse. A day of heavy rain or a road closure can pull a month down and make a healthy store look weaker than it is. In a small shop, where daily volumes are modest, a single day carries more weight than it would in a large mall.
The fix is not to ignore unusual days. They tell you something about what draws people in. The fix is to look at them separately before they blend into a total.
Look at the shape of the month, not just its sum
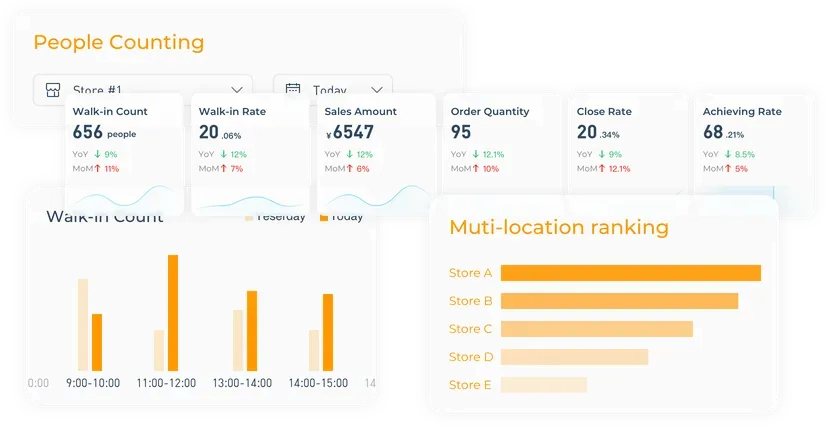
The first step we suggest is to break the month into smaller pieces. Our people counting analytics platform is SaaS software that offers traffic analysis by hour, day, week, month and year, along with traffic trend visualization. Seeing those views side by side makes it easier to tell whether a month has moved gradually or because of a single spike.
A few habits help when reading them:
- Compare like with like.A Saturday belongs next to other Saturdays, not to a quiet Tuesday.
- Check the hourly view for the spike.A rush that lasts two hours tells a different story from a day that stays busy from open to close.
- Look at the weekly view before the monthly one.If three weeks are flat and one is high, the cause is probably specific.
Mark known events such as promotions or holidays, so they are read as events and not as a trend.
Traffic is one part of the picture
A busy day brings more people through the door, but it does not tell you what they did once inside. That is why raw counts can mislead on their own. Our platform also provides store KPI analysis, with walk-in rate analysis, conversion rate analysis and multi-location store ranking, and a real-time dashboard for tracking business actions.
On our retail traffic analytics solution page, we describe a funnel analysis that combines customer flow data with the cash register system. It lets you see walk-in, walk-out and passing-by counts for entrances in different periods, next to what was sold.
If a rush day brings many visitors but the conversion rate drops, that is useful to know. It may point to queues, stock or staffing at peak hours rather than to a healthier month.
The analytics software also covers customer behavior insights, including dwell time, product engagement time, heatmap analysis and queue time. On a crowded day, those views show where people stayed and where they waited.
Comparing stores without the noise
Owners with more than one location face a related problem. A rush at one store can distort a comparison across the group. Our analytics software can generate multi-store comparison reports by selecting a time range and data conditions, and the results can be exported to Excel.
When comparing multiple stores, we recommend reviewing the full reporting period first, then running a separate comparison that identifies unusual events. This helps distinguish normal operating patterns from temporary traffic spikes without losing sight of the additional visitors those events may have generated.
For a single small store, the same logic applies over time. Compare this month with the same month last year, or compare a promotion week with an ordinary week, so that the event is measured on its own terms.
Questions we suggest asking before changing plans
When a monthly line moves sharply, we find a short list of questions keeps decisions grounded:
- Did the rise come from one day or from several?
- Did the walk-in rate change, or just the number of people passing?
- Did conversion move with traffic, or against it?
- Would the month look different without the busiest day?
These questions do not call for a large project. They call for traffic data that can be broken down by hour and day, and a way to read it next to sales.
A busy day is worth celebrating and worth studying. With people-counting analytics showing the shape of the month and retail traffic analytics linking visitors to purchases, a small store can plan from its usual pattern and still learn from its busiest days.


