Why a Higher Conversion Rate Can Hide Fewer Transactions
In physical store management, conversion rate has long been treated as a primary performance metric. When store conversion percentages rise, management teams often celebrate a successful week.
However, relying on conversion rate in isolation can create a misleading picture of retail operations. A physical location can show a noticeable spike in its conversion percentage while total transactions, overall revenue, and visitor footfall decline sharply.
Understanding why this mathematical illusion occurs helps store leaders address operational bottlenecks before sales volume drops further.
The Mathematical Mechanism of Conversion Metrics
Conversion rate measures the proportion of store visitors who complete a purchase. It is generally calculated by dividing the number of purchasing visitors by the total number of store visitors. Because this metric depends on two changing variables, a shift in either figure can affect the final percentage.
Imagine a retail location that receives 1,000 visitors on a typical business day and completes 100 sales transactions. The conversion rate stands at 10%. Now suppose external factors, such as inclement weather, regional traffic disruptions, or altered shopping hours, reduce foot traffic down to 200 visitors. If 35 of those remaining visitors make a purchase, the conversion rate climbs to 17.5%.
On paper, operational performance appears to have improved by 7.5 percentage points. In reality, total sales transactions plummeted from 100 to 35, representing a 65% drop in transaction volume. The percentage increased simply because visitor traffic collapsed faster than total purchases did.
This dynamic frequently occurs when high-intent buyers form the majority of remaining traffic. High-intent shoppers enter a store with a specific purchase goal and usually buy regardless of minor store barriers.
While their presence boosts the conversion percentage, total footfall remains depressed, leaving the store with reduced overall revenue and fewer completed orders. At OVOPARK, we frequently see how isolating this single metric leads chain store operations to misjudge true store health.
Uncovering Operational Blind Spots
When chain retail teams judge store health solely by conversion percentages, they risk overlooking underlying operational challenges. A rising conversion rate alongside falling transaction numbers signals several critical operational issues across chain locations:
- Shrinking Customer Attraction:Storefront promotions, window displays, or seasonal marketing campaigns may fail to draw passing traffic into the location. Without evaluating incoming customer volume against passing footfall, marketing teams cannot gauge campaign reach accurately.
- Loss of Casual Browsers:Casual visitors often drive incremental sales volume and larger basket sizes over time. A decline in total foot traffic impacts casual browsers first, leaving mostly deliberate shoppers in store and reducing long-term brand engagement.
- Misaligned Staffing Schedules:Overstaffing during low-traffic periods or understaffing during peak traffic hours inflates operational expenses or leads to missed customer service opportunities. Without evaluating actual visitor entry patterns, shift scheduling relies largely on guesswork.
To address these blind spots, modern chain store operations rely on multi-stage funnel tracking. By analyzing passing-by traffic, walk-in counts, dwell times, and transaction counts together through modern retail analytics software, retail leaders pinpoint exact points of customer drop-off instead of making operational changes based on incomplete data.
Building Clear Visibility with Traffic Intelligence
We help retail brands transform physical store operations through accurate footfall monitoring and unified data intelligence. Managing hundreds or thousands of store locations requires clear, unbiased visibility into how visitors move through every stage of the customer journey.
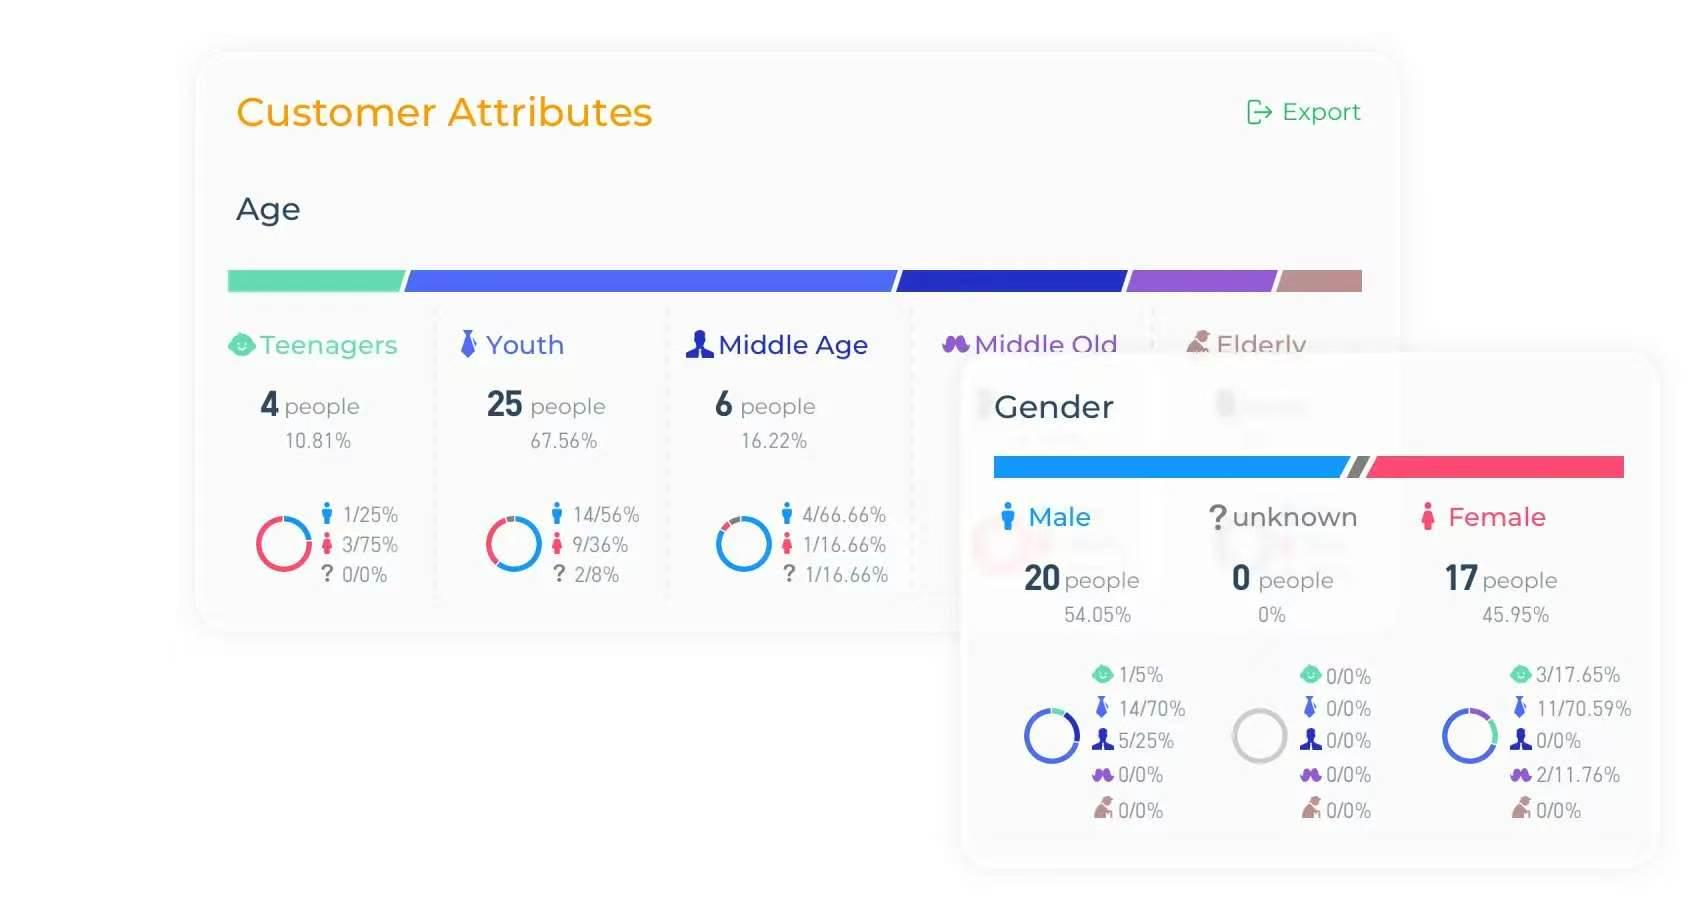
Deploying specialized hardware devices alongside cloud platforms enables store operations teams to separate foot traffic volume from actual buyer behavior. Our platform provides real-time traffic analysis, walk-in rate metrics, customer demographic insights, heatmap tracking, and store KPI evaluation dashboards.
By linking hourly and daily footfall metrics directly with point-of-sale transaction data, store managers gain a true visual breakdown of store health across different regions.
For retail chain operations seeking to diagnose store bottlenecks, deploying comprehensive retail footfall analytics maps the complete conversion funnel. Instead of relying on an isolated rise in conversion percentages, store managers can track incoming visitor volume alongside total transaction counts across all store locations in real time.
When store leadership teams evaluate traffic volume and conversion metrics side by side, they take proactive steps to support consistent revenue growth:
- Optimize Labor Scheduling:Align sales associate schedules with peak incoming footfall hours to maintain appropriate service levels when visitor traffic surges.
- Refine Storefront Merchandising:Compare passing-by traffic against walk-in counts to evaluate the effectiveness of window displays and entrance layouts.
- Benchmark Multi-Store Performance:Rank stores based on actual visitor traffic and conversion efficiency, identifying high-performing venues and those requiring operational adjustments.
Looking Beyond Isolated Metrics
Conversion rate remains an informative operational metric, but evaluating it without broader contextual data can lead to skewed conclusions. A store that records fewer total sales transactions despite an elevated conversion percentage faces a traffic volume deficit that requires prompt operational attention.
By unifying edge AI traffic devices with cloud analytics platforms, retail operations gain transparent insights into every store location. Tracking the complete customer journey allows management teams to refine store strategies, align labor resources effectively, and support sustainable growth across all physical channels.