
Sales Are Up but Footfall Is Down: What Should a Retailer Check?
When sales rise while store visits fall, the numbers can look contradictory. They may reflect fewer people entering but higher spending per transaction, stronger conversion, or a shift toward higher-value products. At OVOPARK, we recommend reading sales alongside customer-journey data before changing store operations.
First, check whether the numbers are comparable
Start with the period, stores, and definitions used in each report. Compare the same days and hours, and account for public holidays, seasonal shifts, store closures, local events, and unusual promotions. A week with a strong weekend promotion should not be compared casually with a quieter week from another season.
Next, check how each metric is defined. Does “footfall” mean people entering the store, people passing the storefront, or both? Are returns, cancelled transactions, online orders collected in-store, and staff purchases handled consistently in sales reports?
If the traffic counter and point-of-sale system cover different locations or time windows, the apparent gap may partly reflect measurement rather than customer behavior.
For chain retailers, compare like with like: similar store formats, locations, opening hours, and reporting periods. An overall sales increase can also hide weaker results in individual locations.
Separate bigger baskets from better conversion
Sales can grow with fewer visitors when average transaction value increases. Check average order value, units per transaction, product mix, and the share of sales from premium or higher-priced items. A small number of larger purchases may lift revenue even as visits decline.
Then review conversion rate—the proportion of visitors who make a purchase. If fewer people enter but a greater share buy, the store may be attracting a more purchase-ready audience or benefiting from a product or promotion mix that encourages decisions.
If conversion falls as well, investigate availability, price changes, queue length, product discovery, service coverage, and whether the offer matches local demand.
Our approach to retail customer analytics brings traffic patterns together with measures such as walk-in rate, conversion rate, dwell time, queue time, and store-level comparisons. These metrics do not explain every cause by themselves, but help teams decide what to examine next.
Look beyond the entrance count
A falling entry count does not reveal where interest is being lost. Storefront passerby counts and walk-in rates can distinguish lower activity around the site from a reduced share of passersby choosing to enter.
If passing traffic is stable but the walk-in rate declines, consider storefront visibility, window displays, signage, opening-hour expectations, nearby construction, and the relevance of current campaigns.
Inside the store, dwell time and heatmaps can show whether shoppers spend time in key areas or move through without engaging. Longer dwell time is not automatically better: customers may be browsing with interest, waiting for assistance, or navigating a confusing layout. Interpret it alongside queue time, purchase outcomes, product engagement, and observations from store staff.
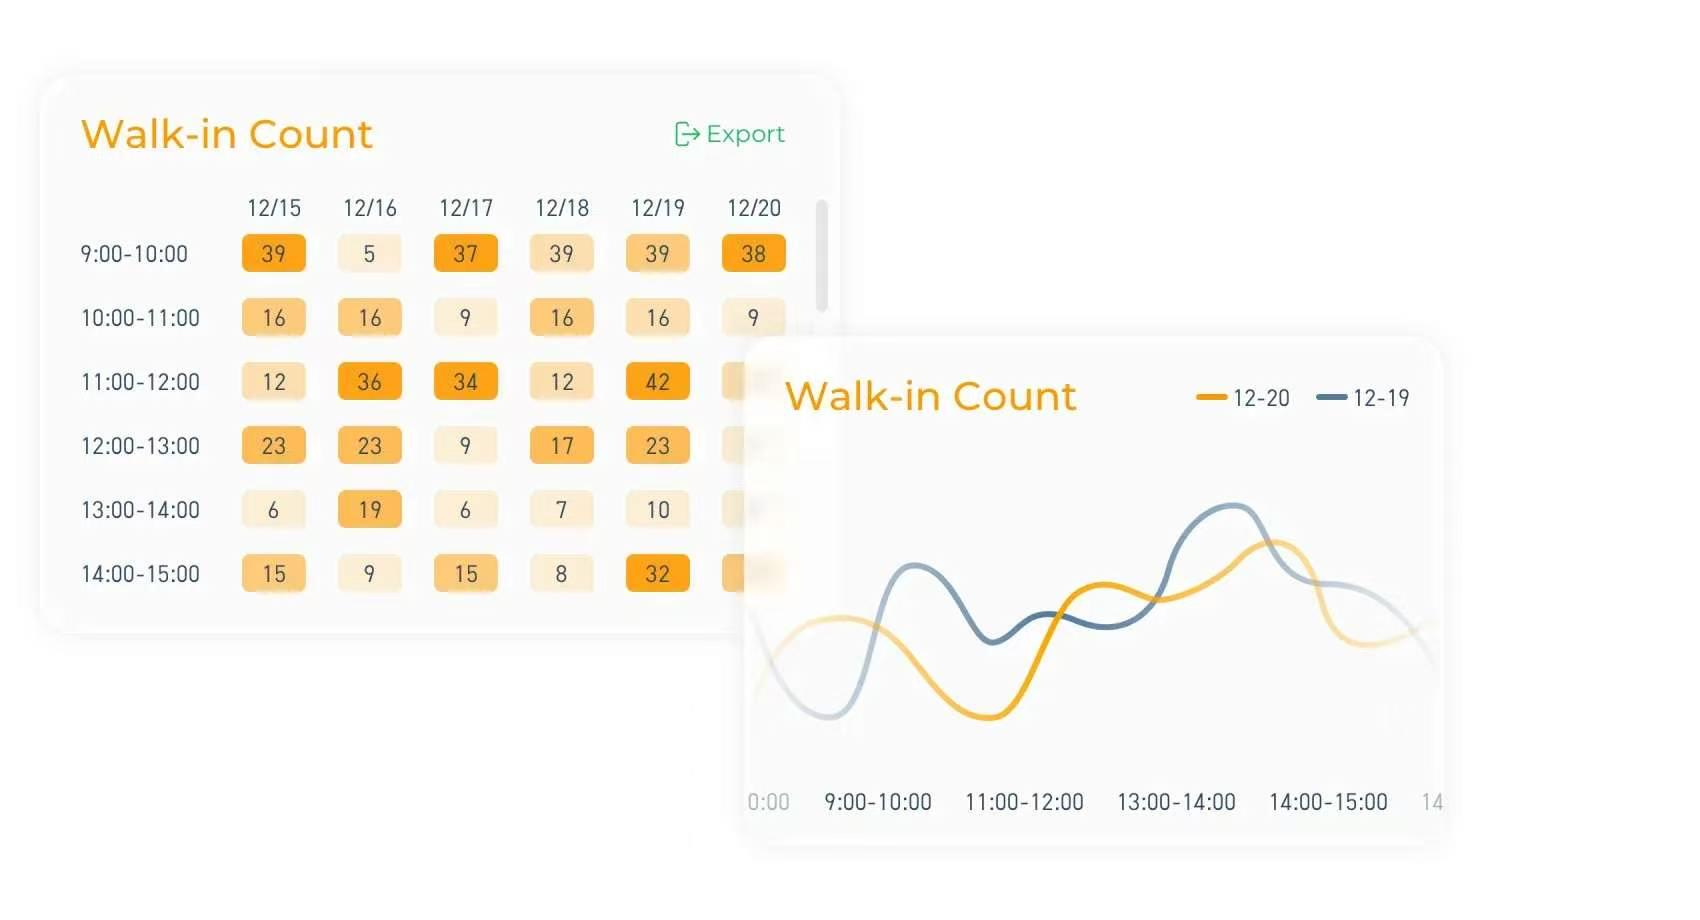
Also check staffing by hour. A store may receive fewer visitors overall but still experience peaks when service queues form or popular items run low. Hourly patterns can help managers align coverage with demand rather than relying only on daily totals.
Check the data before changing the store
Before acting on an unexpected decline, review counter placement, entrance coverage, camera views, and recent layout or equipment changes. Confirm that the same entrances and counting rules are used throughout the comparison.
If you plan to use existing camera equipment, we recommend checking its compatibility with our analytics platform first. Our technical team can review the equipment details and advise on a suitable integration approach.
Our store traffic analytics solution helps retailers review entry, exit, and passing-by traffic across different periods. When sales or cash-register data is available, teams can compare customer flow with transactions and study performance across stores. The platform supports traffic trends from hourly through yearly views, helping teams put short-term changes in a broader context.
For multi-store operators, make the investigation specific. Rank locations by the size and timing of the footfall change, then compare conversion, transaction value, opening hours, local conditions, and campaign activity. Avoid applying one solution everywhere: a declining walk-in rate calls for a different test than shorter dwell time near a key category or queues during peak hours.
Turn the signal into a testable next step
Once the likely cause is clearer, choose one practical action and define how success will be measured. A store with weak walk-in rates might test new window messaging. A location with queues could adjust peak-hour staffing.
A store with steady traffic but lower conversion might review stock availability, product presentation, or how quickly shoppers can get help. Compare results against a suitable baseline and track both sales and visitor behavior so that improvement in one metric does not obscure a decline in another.
The goal is not to maximize footfall at any cost. It is to understand how visits translate into transactions and where a change may improve the customer experience or business performance.
When revenue and traffic point in different directions, read them together, validate the underlying data, and investigate the part of the journey where the pattern changes. That gives retail teams a more grounded basis for decisions than either number alone.


