
How to Read Retail Performance Changes Without Misleading Your Team
Retail reports often use percentages to summarize performance, but not every percentage tells the same story. A KPI may rise by 5%, while another improves by five percentage points.
They sound similar but describe different changes. At OVOPARK, we encourage retailers to distinguish between relative growth and a change in a rate before judging whether a campaign, store layout, or staffing adjustment worked.
Two percentages can describe different things
Percentage growth measures how much a value has changed relative to its starting value. Percentage-point change measures the direct difference between two percentages.
Consider a store whose conversion rate moves from 20% to 24%. The rate has increased by 4 percentage points, because 24 minus 20 equals 4. In relative terms, conversion has grown by 20%: the four-point increase is divided by the original 20% rate. Both statements are correct, but they answer different questions.
The same distinction applies to walk-in rates and other retail KPIs expressed as percentages. If a campaign raises the walk-in rate from 10% to 12%, that is a 2-percentage-point increase and a 20% relative increase. Reporting only “up 2%” is unclear: some readers may interpret it as relative growth, while others may understand it as two points.
For counts and monetary values, relative growth is often the natural comparison. If a store records 1,200 visits this week after 1,000 last week, visits increased by 20%. For a rate, teams should report both the new value and the point change when the distinction matters.
Why this distinction matters in store operations
A percentage can look impressive or modest depending on the baseline. A conversion rate moving from 2% to 3% gains one percentage point but rises 50% relative to its starting level. A move from 30% to 31% also gains one point, yet relative growth is about 3.3%.
This matters when managers assess stores and campaigns. A smaller store starting from a low conversion rate may show a large relative increase, even if the absolute improvement is modest.
A mature store with a higher starting rate may generate more additional transactions from a similar point change, depending on traffic volume. Neither measure should be read in isolation.
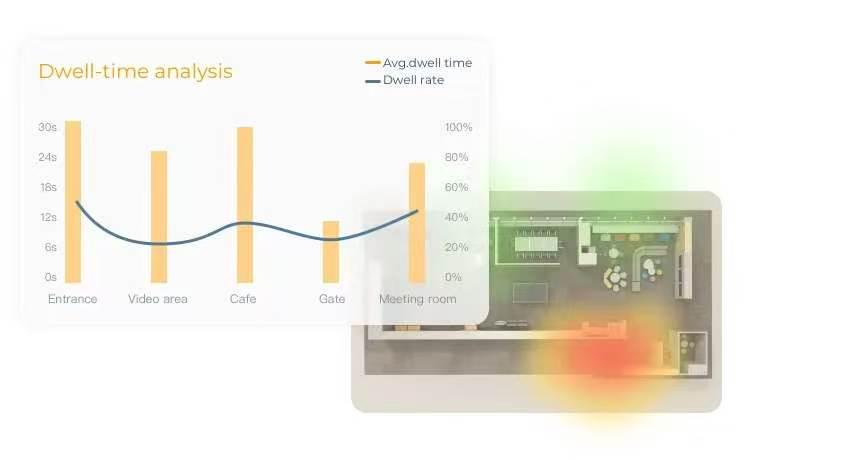
Foot traffic, walk-in rate, conversion rate, dwell time, queue time, and transaction figures each describe a different part of the customer journey. Looking at them together can help teams investigate what changed instead of treating a single percentage as the whole explanation.
Read the rate beside the number behind it
A rate needs context. When conversion rises, ask whether visitor numbers stayed stable, increased, or fell. If conversion moves from 20% to 24% while walk-in traffic remains at 1,000 visitors, the number of purchasing visitors increases from 200 to 240, assuming consistent definitions and reporting periods.
If traffic falls substantially, however, a higher conversion rate may not translate into more purchasing visitors or transactions overall. If traffic falls substantially, a higher rate may not translate into more transactions overall.
The same principle applies to campaign analysis. Compare the campaign period with a suitable baseline, align weekdays and store opening hours, and note changes in discounts, product availability, local events, or seasonality.
Check that the numerator and denominator are defined consistently. A conversion rate based on transactions divided by counted entries should not be compared casually with one calculated using a different visitor definition.
Our retail analytics system presents traffic patterns across hourly, daily, weekly, monthly, and yearly periods, along with KPI views such as walk-in rate, conversion rate, and multi-location store rankings.
Retailers can use these views to compare like periods and examine whether traffic, conversion, and other available indicators moved together. These reports support investigation; metric definitions still matter.
Build a more useful KPI comparison
A clear report can use a consistent three-part format: the previous value, the current value, and the change. For rates, state the percentage-point difference and, when useful, relative percentage growth separately.
For example: “Conversion rate rose from 20% to 24% (+4 percentage points; +20% relative growth).” For store visits: “Visits increased from 1,000 to 1,200 (+200; +20%).” Readers can see the baseline and follow the calculation.
Use the same format across locations and periods, with the date range, data source, and KPI definition. When comparing stores, account for opening hours, entrance coverage, and store format. Label point changes and relative growth separately across dashboards and summaries.
Turn the numbers into a practical next step
Useful retail intelligence comes from connecting a metric to a question the team can act on. A rise in conversion with declining traffic may prompt a review of marketing reach.
Stable traffic with lower conversion may lead to checks on stock availability, queues, service coverage, or product presentation. A strong relative increase from a low baseline may deserve recognition, but managers should also consider transaction volume and sales impact.
At OVOPARK, we focus on making store traffic and KPI information easier to review across locations and periods. Our platform offers traffic analysis, behavior indicators such as dwell time and heatmaps, queue-time information, and KPI reporting.
These measures help teams review where performance changed. Naming the calculation, showing the starting value, and checking the operational context can make reports easier to interpret and decisions easier to explain.